Browns Data Spotlight (Week 5)
Our weekly effort to take valuable, yet confusing, NFL data and summarize what the charts are telling us about the Cleveland Browns.
As a companion to the data discussion we have on the Friday pod each week, we will be taking a look at the most interesting/relevant data released between games in an attempt to gain better understanding and look for trends as the season progresses. To that end, here are the three we’ve chosen for this week.
Data Set No. 1
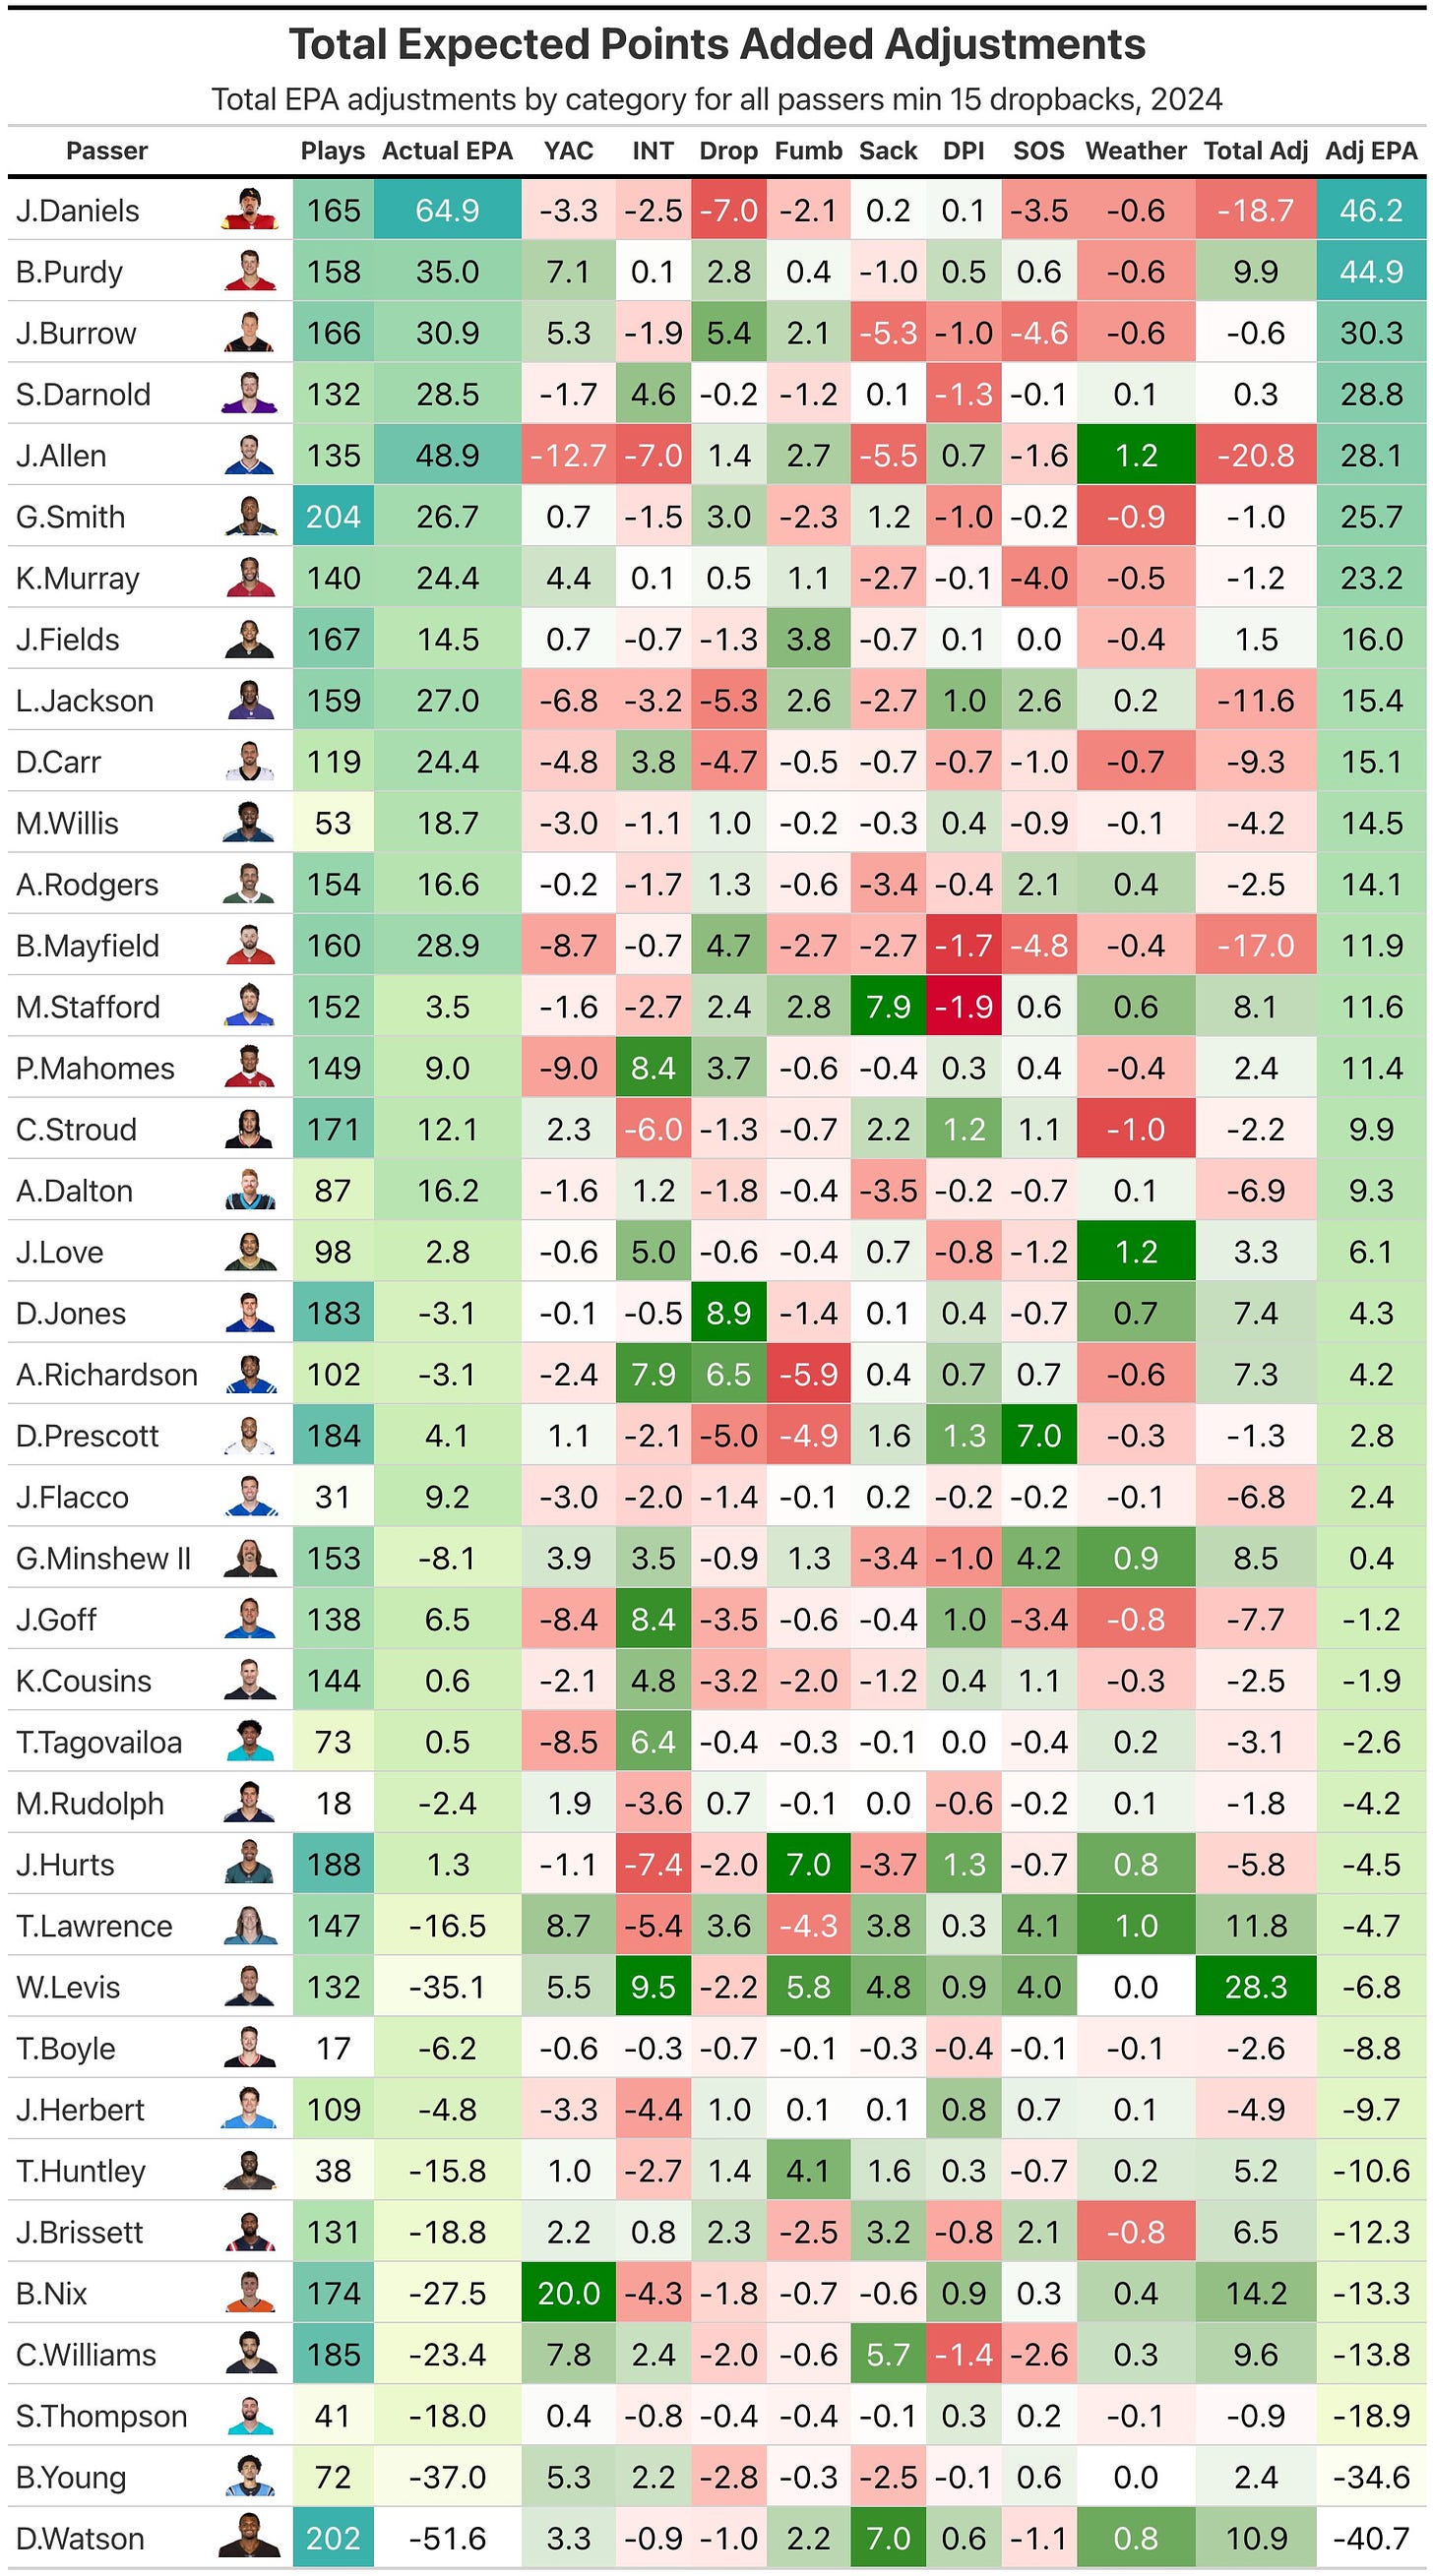
We begin today with Kevin Cole’s “Adjusted Quarterback Efficiency (AQE)” through Week 4: This is an excellent breakdown attempting to isolate quarterback EPA from factors such as YAC (yards after catch), interception luck, drops, fumbles, pass blocking, penalties, strength of schedule and even weather. Here Watson is given one of the largest positive adjustments to his EPA, here are the results:
Key Points
Watson receives one of the largest positive adjustments due to factors outside his control
Despite that adjustment, Watson is orders of magnitude lower than his peers in adjusted EPA/Play at -0.2 per dropback
The Browns and Watson are averaging more than 10 points(!) per game less than expected from the passing game
Takeaway - Make no bones about it, this is truly an eye opening number to look at. Watson’s performance—isolated from all other factors—is leaving 10 points a game on the table from average quarterback play. His film last week in Las Vegas has opened the door to hope for drastically better play moving forward where there was little prior to last week.
Keep reading with a 7-day free trial
Subscribe to Browns Film Breakdown to keep reading this post and get 7 days of free access to the full post archives.


