Browns Data Spotlight (Week 6)
Our weekly effort to take valuable, but at times confusing, NFL data and summarize what the charts are telling us about the Cleveland Browns.
As a companion to the data discussion we have on the Friday pod each week, we will be taking a look at the most interesting/relevant data released between games in an attempt to gain better understanding and look for trends as the season progresses. To that end, here are the three we’ve chosen for this week.
Data Set No. 1
Next we have a group of related data from Kevin Cole (which if I haven’t stated before, is an excellent source for NFL data analysis - follow him on twitter, his pod, and Substack if you like this kind of league wide analysis)
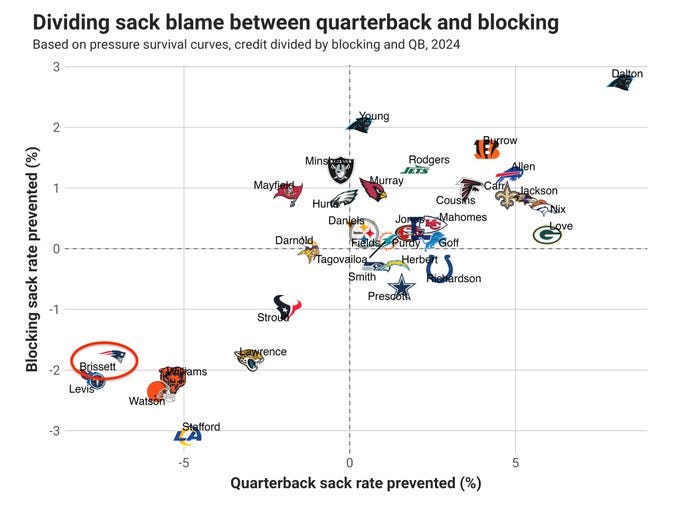
Here is last weeks chart comparing pass protection vs QB sack avoidance -
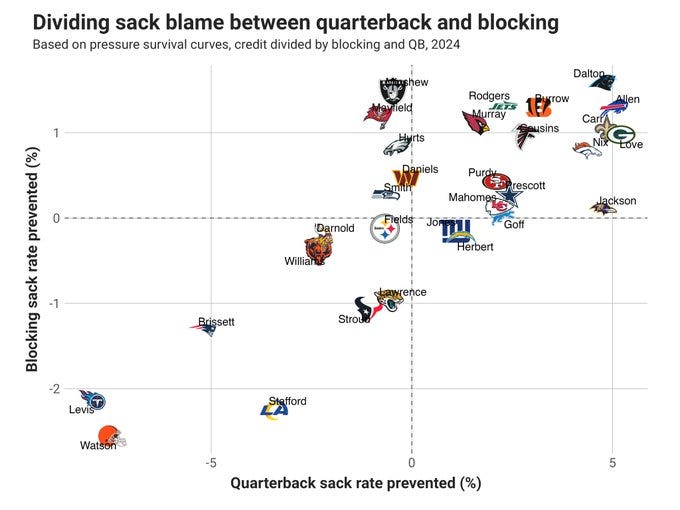
And here is the updated chart after week 5
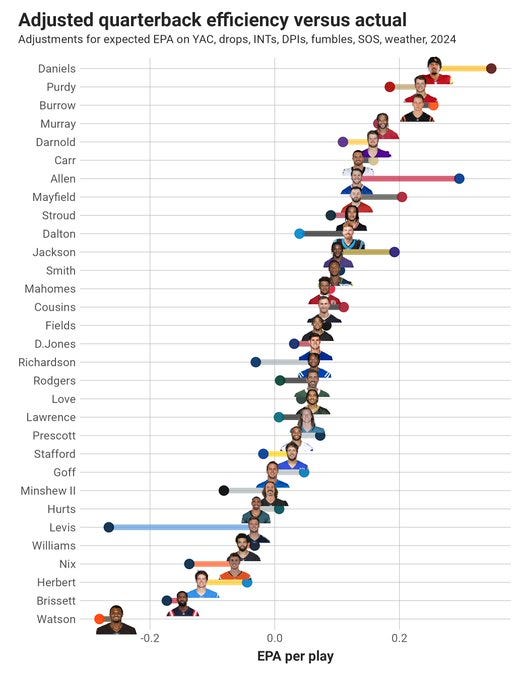
And finally, an update graph for Adjusted Quarterback Efficiency
Key Points
Watson is separating himself from the pack as the season progresses, now grouped only with Will Levis in avoiding sacks and receiving relatively poor pass blocking.
When looking at Adjusted Quarterback Efficiency however, we can see that Watson is no longer receiving as large of a positive adjustment for factors outside his control, while Levis is.
Takeaway - As more data comes in, Watson continues to separate himself from the rest of the NFL as the leagues worst current starting quarterback, even when isolated from all other measurable factors
Data Set No. 2
Keep reading with a 7-day free trial
Subscribe to Browns Film Breakdown to keep reading this post and get 7 days of free access to the full post archives.


